Without geography, you are nowhere
Jimmy Buffet
It has always been a human endeavor to know the location of where a person is placed. From the Primitive times of Ancient Greeks, Herodotus coined the inhabited world as “Okiolumene” maps towards the age of explorations. Mercator maps gained popularity when exploration of the new world paved the way when the Naval ships used those maps. Maps which post-renaissance paved the way for European Colonization of most parts of the world.

In the picture, the earliest maps of Ancient Greek Historian Herodotus
Picture Source: Map of the World as Herodotus, The Father of History, Knew It (greekreporter.com)
Modern-day digital maps on smartphones have aided customers with routing guidance through GPS devices, which took much work to fathom during the wireless age. Maps certainly have come a long way from vast paper drawings towards fingertips movements on a smartphone device; behind this idea is the concept of GIS (Geographical Information System) that answers two vital questions: Where? And What?
It is hard to define it since it encompasses many elements comprehensively. Still, its closest definition in the true sense has been made by ESRI and National Geographic.
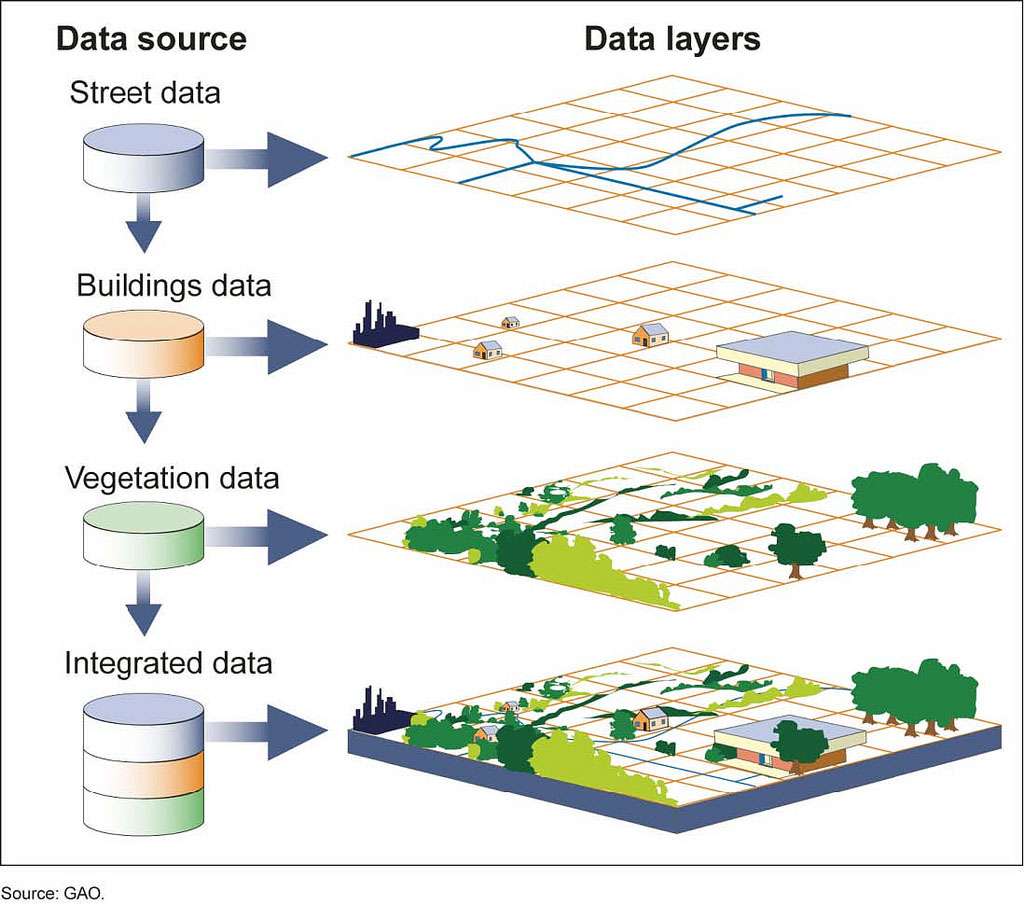
The National Geographic Society classified it as a geographic information system (GIS), a computer system for capturing, storing, checking, and displaying data related to positions on Earth’s surface. GIS can show many data on a map, such as streets, buildings, and vegetation. This enables people to see patterns and relationships more easily. (GIS (Geographic Information System), n.d.).
Another Prominent Map Software organization ESRI defined it as “A geographic information system (GIS) is a system that creates, manages, analyses, and maps all types of data. GIS connects data to a map, integrating location data (where things are) with descriptive information (what things are like there). This provides a foundation for mapping and analysis in science and almost every industry. GIS helps users understand patterns, relationships, and geographic context. The benefits include improved communication and efficiency and better management and decision-making (esriuk, 2019).


(The Concept of GIS fuses two elements of Attributes and Location)

In this picture, an excellent example of Attribute and Location is taken from a simple Google Earth Image of the Taj Mahal: Location element would be Latitude: 27°10’28.52″N Longitude: 78° 2’32.50″, Elevation: 631 feet, and the Attribute Element will be Taj Mahal and its relevant website tajmahal.gov.in along with the phone number of the tourist Centre would be its attribute element
Imagery Source: Google Earth Pro
GIS can use any information that includes location. The location can be expressed in many ways, such as latitude and longitude, address, or ZIP code. Many different types of attribute information can be compared using GIS. The system can include data about people, such as population, income, or education level. It can consist of information about the landscape, such as the location of streams, different kinds of vegetation, and different kinds of soil. It can include information about the sites of factories, farms, and schools or storm drains, roads, and electric power lines. (GIS (Geographic Information System), n.d.).

(As shown in this Image, Geographic Information Map is a combination of many-layered datasets: Picture Source: gis.jpg (1024×905) (nationalgeographic.org))
Short History of GIS

The early days of GIS were very lonely. No one knew what it meant
Roger Tomlinson (Canadian Geographer considered to be the founder of GIS)

(In this picture taken, a brief timeline of the evolution of GIS: Source (History and Development of GIS, n.d.)
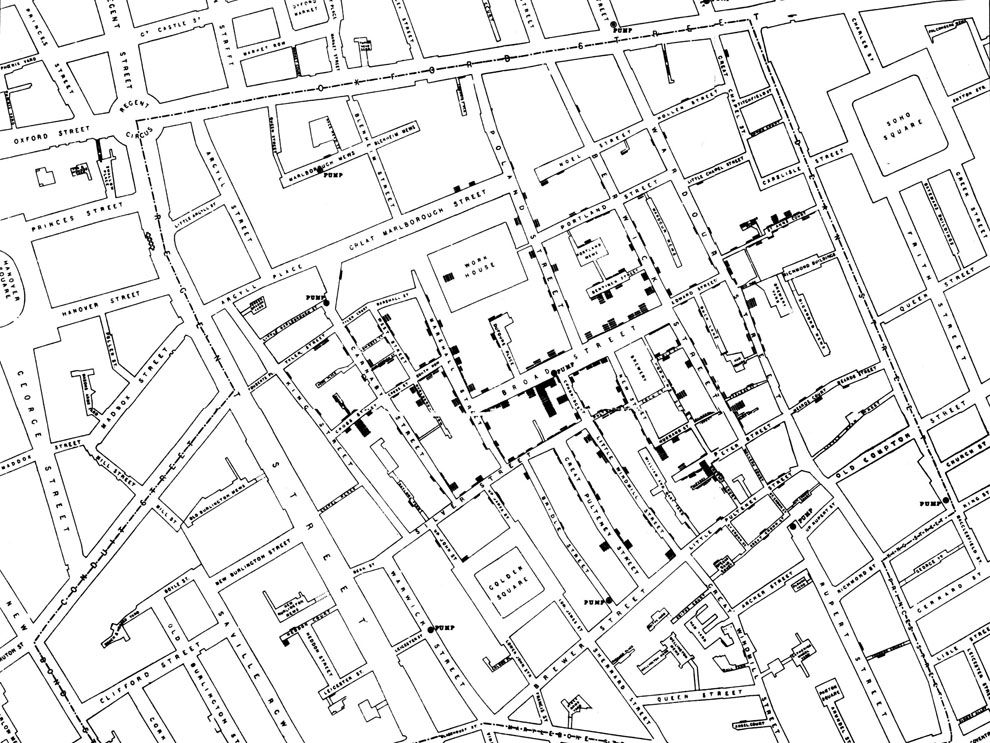
Although making maps was done eons time, the concept of layered mapping to provide Geospatial Information was first traced by John Snow’s Cholera Map of 1854 with the City of London suffering from the Pandemic; John Snow started Mapping Locations during the outbreak of cholera and found viable proximity to the city roads, residential or commercial properties and water lines of that time.
However, for the next 100 years, sieve mapping and paper maps became prominent within various thematic disciplines. It was not until 1960 when an employee of the Canadian Government, Roger Tomlinson, created the first layered map digitally of the Canadian Landcover. This was undoubtedly the age of pioneering for the field, and Roger Tomlinson is considered the Father of GIS.
Many commercial establishments picked up from where Roger Tomlinson started a layered approach Mapping, including organizations like ESRI and commercially propagated the discipline of GIS through their Properties of ArcMap.

In this picture, a representation of John Snow’s Cholera Map where there could track the cholera outbreak due to an infected water pump
Picture source: 27636.jpg (990×743) (nationalgeographic.org))
The 90s marked a cornerstone era of locational Intelligence as the American GNSS (Global Navigational Satellite Systems) was declassified by President Clinton, which paved the way for commercial GPS technology with Portable Navigational devices within Locomotive vehicles. Locational navigational companies like TomTom, Garmin, and NAVTEQ were thriving.

Many Portable Navigational devices became famous as the American GNSS, better known as GPS, became declassified
Picture source: Getty Images
After 2010 however, the age when users of Geospatial data started to demand the need for greater access to Geospatial Information when smartphone devices became the talk of the town, many mapping platforms like Google Maps, Bing Maps and Open Street Maps became easily accessible to edit without any lucrative payment to access its geospatial information which during the majority of the GIS history was a norm to deal with.

In this picture: This is Humanitarian Open Street Maps account, where we map building footprints in Syria. By building footprints, humanitarian organizations and first responders can estimate building damages and the population density in these areas:
Source: http://hotosm.org/
Forms of Digital Data

(Data in GIS is stored in a Geodatabase, also called a Spatial Database; the data structures would include geometric vector properties like Point, Line and Polygon and Satellite or other remote sensing imageries in a pixel format called Raster files which are in turn stored in a SQL based Attribute table:
Picture source :(History and Development of GIS, n.d.)
GIS data is modelled into two formats Vector data and Raster data. Vector data is the most common type of GIS data. Most data loaded into a GIS software program is in vector data. Vector data represents geographic data symbolized as points, lines, or polygons. (Dempsey Caitlin, 202 C.E.)
Raster data represents geographic data as a matrix of cells containing an attribute value. While the area of different polygon shapes in a data set can differ, each cell in a raster data collection is the same cell. The size of the area in the real world that each cell represents is known as the spatial resolution (Dempsey Caitlin, 202 C.E.).

In this Image shows the representation of features in Points, Lines and Polygons; Individual Trees are represented in Point features, Settlements are described as Area features and rivers and roads are defined as Linear features
Picture Source: QGIS.org

A Representation of Raster data with color gradients
Picture source: Introduction to Raster Data – Introduction to Geospatial Concepts (datacarpentry.org)
Types of Digitization
The most popular form of converting Geographic data into digital form is digitization. Digitization involves tracing vector spatial data objects like lines, points, and polygons. Digital data is typically represented as numbers or symbols such as texts or graphics; The process involves converting Analogue images into digital ones.
There are various types of digitization methods; Manual Digitization is a process in which an image is copied manually to create a digital file. It is done with the help of digitizing tablets with an instrument known as the puck. The highest accuracy comes through this method.

Shown in this Image is the process of Manual digitization with a tablet using a puck instrument on a digital tablet, while on the image on the right, raster digitization using a scanner
Picture source: USGS
Heads up, Digitization is scanning paper documents into digital files. It helps to digitize paper documents without the risk of damage or loss of the original documents.
It also aids in making paperwork more organized and less time-consuming due to significantly cutting the troubleshooting time. Automatic Digitizing converts raster to vector data or 2D or 3D objects into digital data. The primary purpose of automatic digitizing is to increase the speed and efficiency of GIS data collection. With this process, it is possible to collect, organize, and manage large volumes of data efficiently. The primary goal of an automatic digitizer is to provide up-to-date spatial data in real-time. (Spatial Post, 2021).

In this Image, a conventional example of Heads up Digitization of a building
Picture Source: Link

The best form of Automated digitization is drawing on contour lines shown in a tiff file
Picture source: ESRI
Geospatial everywhere?

The application of GIS is limited only by the imagination of those who use it
Jack Dangermond, ESRI Co-Founder
Geospatial maps have been a cornerstone for daily activities. Whether it is to know the weather updates or for daily commutes, the dynamic nature of maps cannot be present. Organizations like Google, Apple, TomTom, and Here Maps have more than 1 billion Points of Interest Areas of Retail outlets, Monuments, Educational Hubs, Restaurants etc. Most navigation maps produced by Here and TomTom are used for daily commuting in various mobile applications of taxi services like Uber and Ola.

(In the map made on QGIS software and overlaid on Google, we can estimate the shortest path from Point A in South St NW Avenue to Point B in Logan Circle of Washington DC Streets: Picture Source: GREd Foundation Map Archives: GREd foundation – GREd Foundation)

(Many Logistics and service companies like Uber use base maps of Tomtom and Apple for their taxi routing services: Picture Source Uber)

Using HERE Maps as many logistic companies use in the base map Amazon locational services over the period for parcel delivery or fleet transportation, it also enables users to monitor their locational privacy settings, which are now become a prime importance
Map Source: HERE Maps on Amazon Location Service | HERE
Apart from navigation and locational intelligence, real-time maps are also used in many other applications ranging from disaster management, weather forecasting, tracking movements, ship cargo transport or, for that matter monitoring. live air traffic.

In this Map Imagery, an hour-by-hour update of Cyclone Freedy when it impacted the Island of Madagascar
Map Imagery Source: Zoom Earth

The tracking of Vessels and ships shown here near the Mumbai Harbor is another real-time Application that is useful for monitoring cargo movements
Map Imagery Source: Free AIS Ship Tracker – VesselFinder

Radar and Thermal Imagery are often used to track cloud cover and area temperatures, which is daily updated as shown in the radar weather imagery of India
Imagery Source: WeatherRadar – Rain, snow, storms and clouds live (weather and radar. in)
The current era of the geospatial revolution has ensured that maps are a part of our lives in this fast-moving digital world, and locational information is now a daily necessity for human mobility.