Disasters over the years, whether man-made or human, have always been a great ordeal for humanity. Over the past few years, disasters have had collateral damage that has scarred humanity’s psychological and progressive development. Mappers do play an integral part in working towards the adverse effects. As mapping technology has made inroads over the years, disasters have been monitored and analysed.
GIS has undoubtedly been a tool to prepare, monitor and assess the impacts and magnitudes of disasters so that a disaster is not a foregone conclusion to humanity.
According to its definition, “Disasters are severe disruptions to the functioning of a community that exceeds its capacity to cope using its resources. Disasters can be caused by natural, artificial, and technological hazards, as well as various factors that influence the exposure and vulnerability of a community (IFRC, 2014).
Natural disasters are large-scale geological or meteorological events that can cause loss of life or property. These types of disasters include Tornadoes and Severe Storms, Hurricanes and Tropical Storms, Floods, Wildfires, Earthquakes, and Drought.
The topic of natural disasters is broad and highly compassing, drawing experts from all disciplines to comprehend the science and methods of coping with the devastating consequences. Given the recent emergence of natural events in the past few decades, large organisations such as the World Health Organization (WHO) and the United Nations have devoted considerable effort to research and education surrounding natural disasters. The United Nations International Strategy for Disaster Reduction (UNISDR), created in 1999 with the mandate of spearheading and coordinating disaster risk reduction, is an example of increased attention to disaster reduction (Prasad & Francescutti, 2016).

(A Radar Image of Tropical Cyclone Freddy approaching the coast of Madagascar on February 21st 2023, which was coming at a wind speed of 220 km/hr.: Gif Source: AccuWeather Enhanced Real Vue™ satellite)
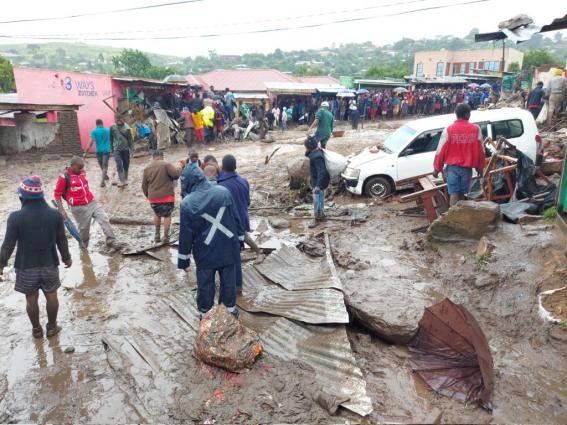
Damage caused due to the category five storm with more than 1,200 fatalities affecting 6 African nations towards the western part of the Indian Ocean; until now, it is one of the worst cyclones in 2023 by sheer magnitude:
Picture Source: Tropical Cyclone Freddy may set new record | World Meteorological Organization (WMO.int)

The worst Natural disaster in 2023 was the Turkey-Syria earthquake, a powerful 7.8 Richter scale earthquake in the Levant region that claimed more than 58,000 lives and an economic collateral loss ranging from 10,000 to 50,000:
Picture Source: The devastating earthquakes in Turkey and Syria might upend politics, too | The Economist
Man-made disasters have an element of human intent, negligence, or error involving a failure of an artificial system, as opposed to natural disasters resulting from natural hazards. Such artificial disasters are crime, arson, civil disorder, terrorism, war, biological/chemical threat, cyber-attacks, etc. (EMMC, 2019)
There is also another definition to it. Man-made Disasters are events which are caused by man, either intentionally or by accident, which can directly or indirectly cause severe threats, either directly or indirectly, to public health and well-being. Because their occurrence is unpredictable, man-made disasters pose an incredibly challenging threat that must be dealt with through vigilance and proper preparedness and response. Information on the primary sources of man-made disasters has been provided here to help educate the public on their cause and effects related to emergency planning. (Stallings, 1998).
They are classified into three types, namely Sociological, Technological and Hazardous material.
Sociology in disasters ranges from the ravages of war, civil disorder, communal violence, terrorism etc. At the same time, technological hazards deal with Industrial Hazard remnants to the ones like the Bhopal Gas tragedy. Other technological disasters like structural building collapse, Power outages, and Forest fires also fall under this category.
The Chornobyl disaster in the late 80s is considered an example of the worst catastrophe due to hazardous material.
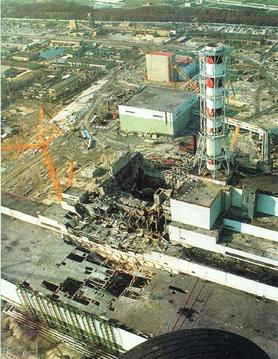
The Chornobyl Disaster of 1986 is the worst radioactive manmade disaster: Picture Source: Wikipedia
Using Burned ratio Index, we can assess the damage of forest fires caused during the Russia-Ukraine War, a kind of man-made disaster using Earth Monitoring technologies: Gif Source: Sentinel Hub EO Browser
Disaster Management Stages and the Use of Earth Observation Technology
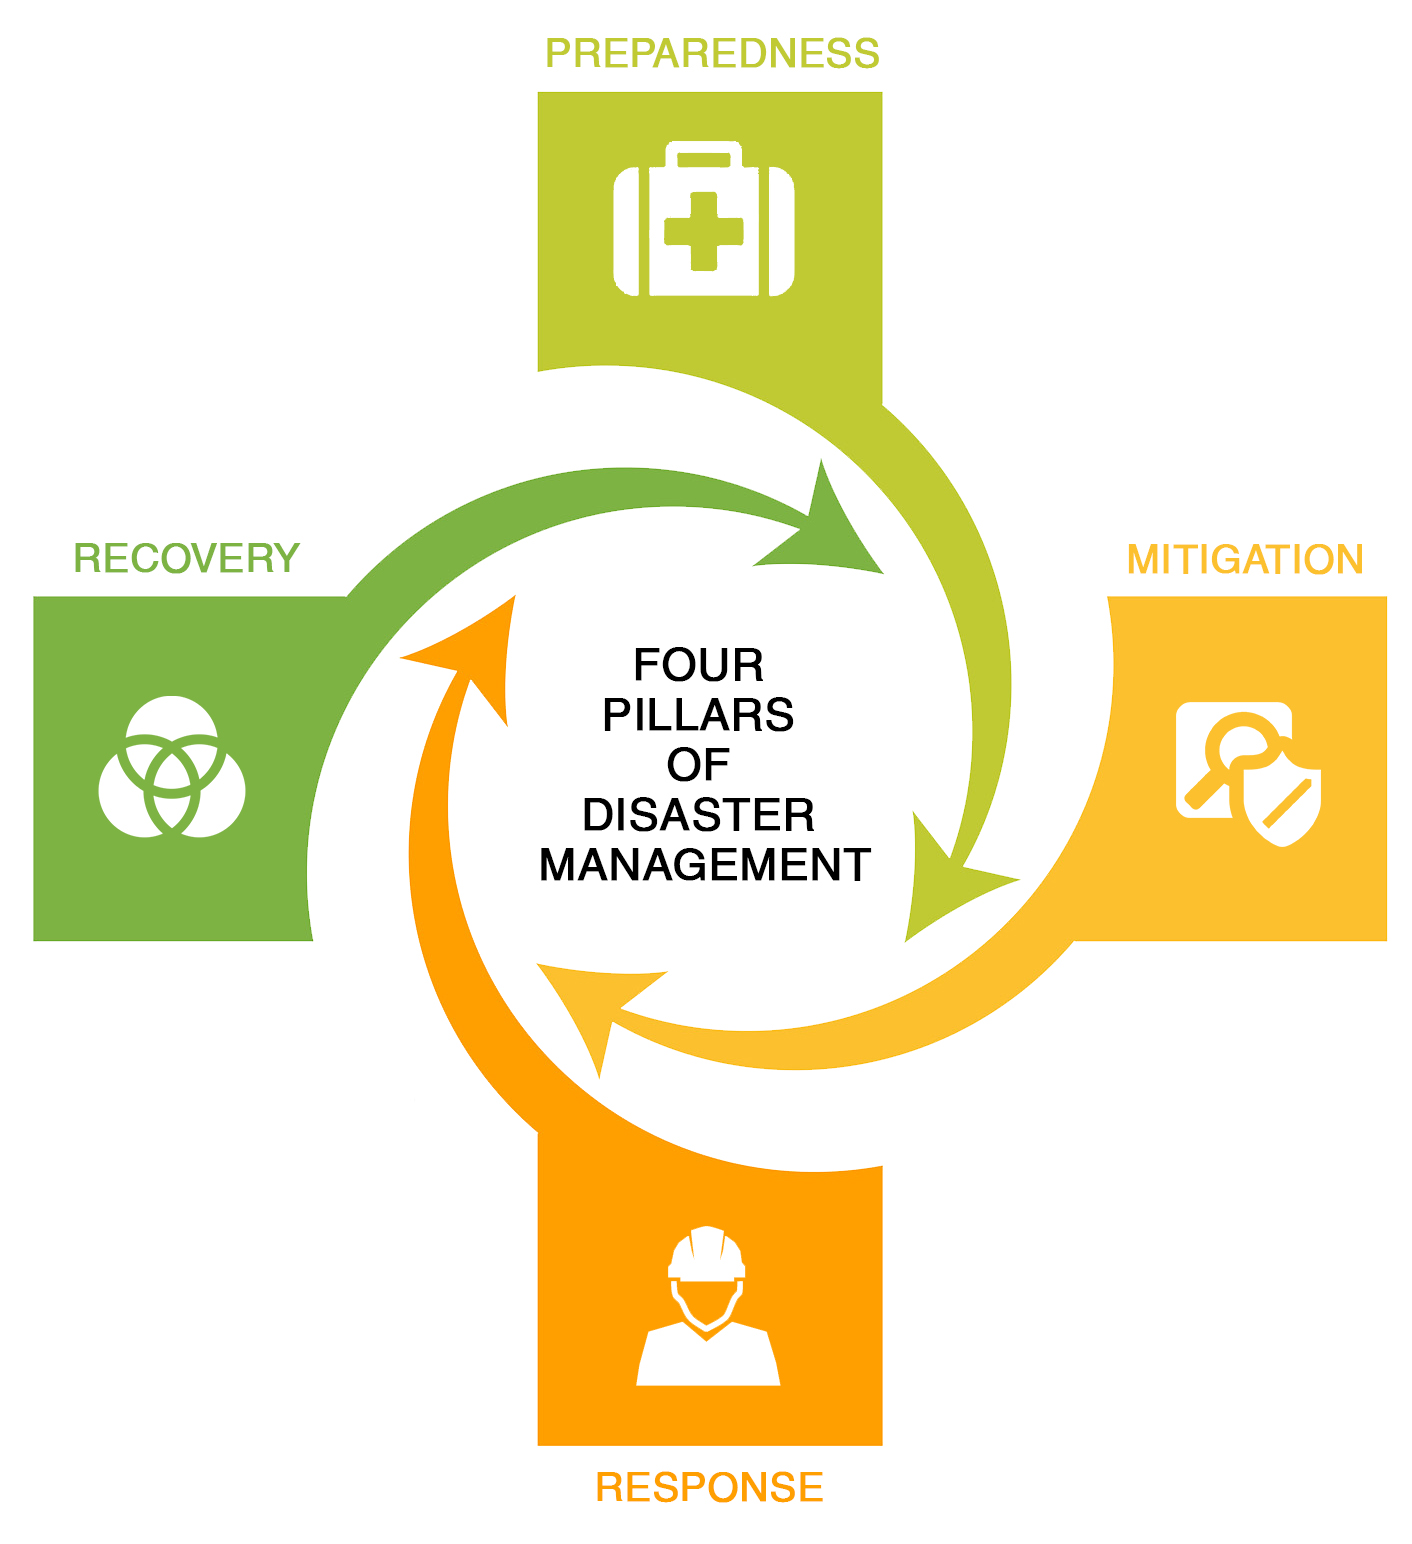
In this picture, the disaster Management cycle: Picture Source: Role of GIS in Disaster Management (rmsi.com)
There are four major stages which start with Mitigation. Phase 1 is mitigation towards the preparedness phase for a disaster event. Then likewise, we head towards response and recovery.
The “mitigation” phase occurs before a disaster takes place. Here, an organisation will protect people and property while decreasing the risks and consequences of a disaster. The main goal is to reduce vulnerability to disaster impacts (such as property damage, injuries, and loss of life) (Meaghan Kelly, 2020).
The “preparedness” phase also occurs before a disaster takes place. Here, an organisation attempts to understand how a disaster might affect overall productivity and the bottom line. The organisation will also provide appropriate education while putting preparedness measures into place. (Meaghan Kelly, 2020).
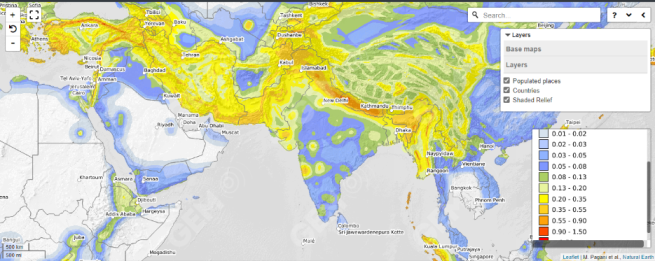
A Seismic Hazard Map of South Asia And the Middle East with the Intensity ranging from 0.00 to 1.50 PGA (g): Map Source: OpenQuake Map Viewer – Global Seismic Hazard Map
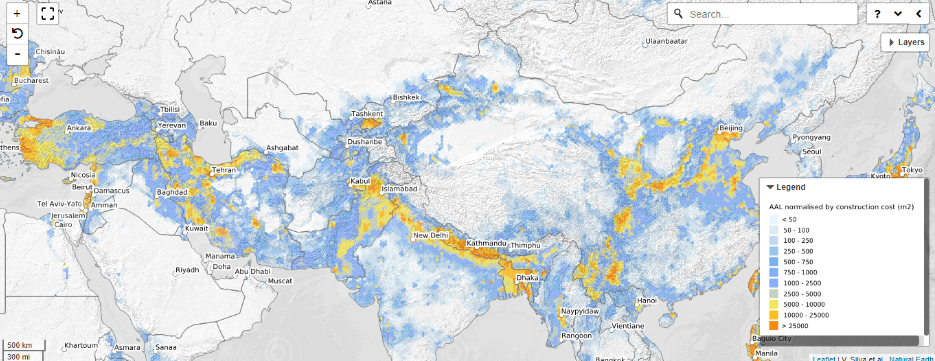
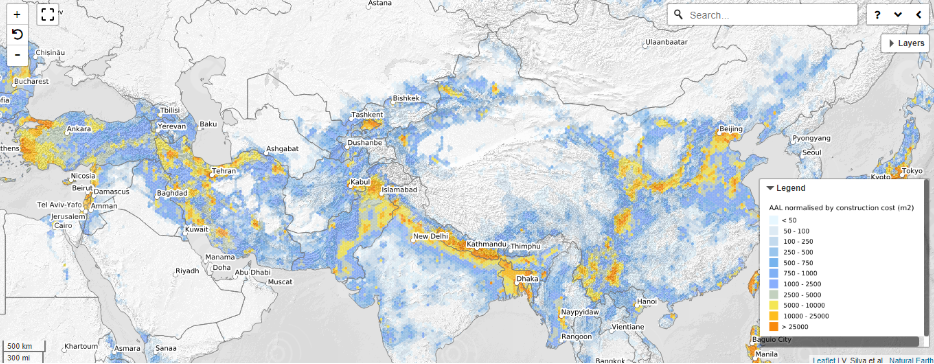
The Global Seismic Risk Map of the Asia Pacific shows interactive map imagery based on normalised construction cost in square meters. They are many areas in the Himalayan and Tibetan that have normalised construction costs of greater than 25000 Average Annual loss per square meter; these maps can help with potential mitigation impacts for construction-related activity which would be vulnerable during the earthquakes
(This is Global Exposure Maps of Earthquakes talks about the exposure of several buildings to an earthquake, What is depicted here is that there is over 250.0 K building exposed, which are in potential seismic zone areas in the Asia – Pacific region, which is critical to mitigation and preparedness: Source: https://maps.openquake.org/map/global-exposure-map/#6/29.162/86.554)
Most mitigation actions can prioritise locations where crises must be determined prior to any disasters.
What damage may occur based on the expected magnitude of an earthquake, characteristics of soils, and other geologic data? In the case of an earthquake, what developments are within the primary impact zone of earthquake faults? What facilities require reinforced construction or relocation? What facilities are in high-hazard areas (key bridges, primary roads, freeway overpasses, hospitals, hazardous material storage facilities, etc.)?(Johnson, 2000).
Preparedness would include actual emergencies. From answering where Fire stations are to be located and the relative response time that is expected, Planning evacuation routes from earthquake rubble to inland locations of coastal inhabitants during cyclones or tsunamis.
Terrain that caught forest fire during Russian Artillery shelling near Kyiv during the initial months of Russia – Ukraine War: Gif Source: Sentinel Hub
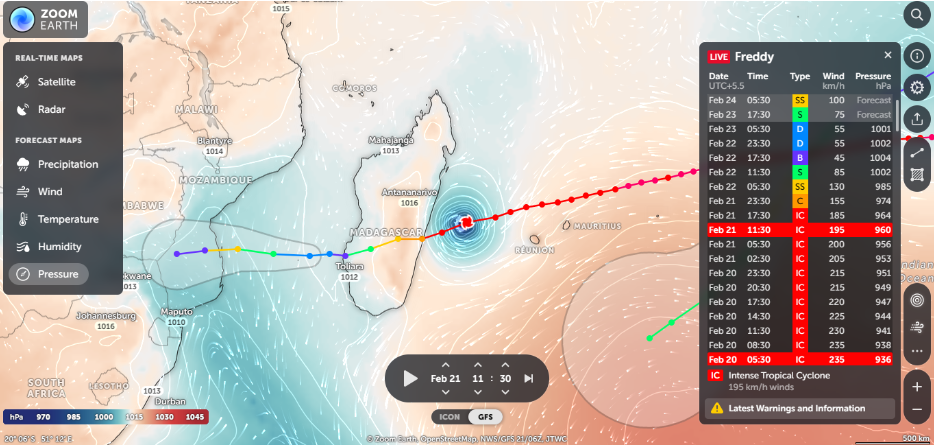
Real Time Maps can be used for preparing evacuation areas during a cyclone by tracking its projected path as seen from Tropical Cyclone path on Madagascar Island with Wind speeds exceeding 195 kilometres per hour. This is important in the response phase: Map Imagery Source: Zoom Earth
The “response” phase occurs in the immediate aftermath of a disaster. Organisations and well-being largely depend on preparedness levels before disaster strikes. Organizations must focus on threats to people, property, and business. (Meaghan Kelly, 2020).
GIS can provide one of the primary components for computer-aided dispatch (CAD) systems. Emergency response units based at fixed locations can be selected and routed for emergency response. The closest (quickest) response units can be selected, routed, and dispatched to an emergency once the location is known. (Johnson, 2000)
The “recovery” phase takes place after a disaster. This phase is the restoration of an organisation following any disaster impacts. By this time, the organisation has achieved at least some physical, environmental, economic, and social stability.
A disaster’s recovery phase can last anywhere from six months to a year (or even longer, depending on the severity of the incident). (Meaghan Kelly, 2020).
Flood monitoring becomes a critical component in response and recovery measures as Sentinel Timelapse monitors the extent of the inundated areas during the Floods in Assam 2022 at Silchar using NDWI Indices, which was a Natural cum Man Made disaster: Gif Source: Sentinel Hub
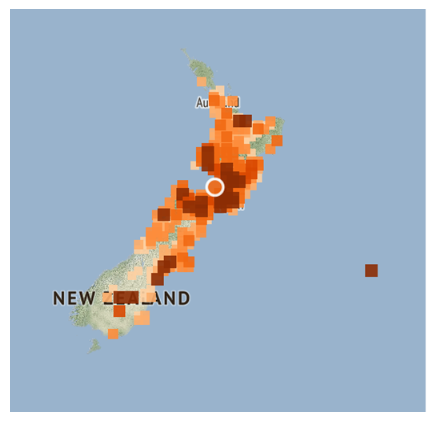
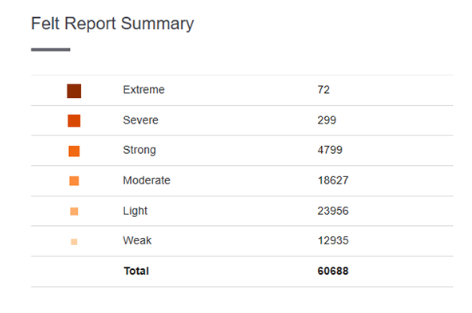
For Earthquake Response and Recovery, it is essential to monitor the Felt responses of aftershocks of the earthquake as shown by the Felt report of the recent February 2023 earthquake in New Zealand; Map Source: Geonet
Organizations using GIS in Disaster Management
One of the prominent organizations to monitor Disaster and Emergency Management is Company Planet. Planet’s high-cadence, high-resolution satellite monitoring capabilities and image archive provide ongoing regional coverage, enabling disaster risk mitigation, rapid response, and informed recovery. New Light Technologies (NLT), a leader in satellite-derived analytics and delivery of real-time decision-support systems for emergency management, works directly with FEMA to integrate near-daily Planet Scope imagery into its disaster response program. NLT and Planet help FEMA assess damages and plan recovery following incidents such as fires, hurricanes, and tornadoes. Planet and NLT rapidly deliver imagery through API and cloud-based platforms to streamline data access and integration with disaster response systems and commercial software platforms such as Esri ArcGIS and Google Earth Engine. (Disaster & Management, 2022).
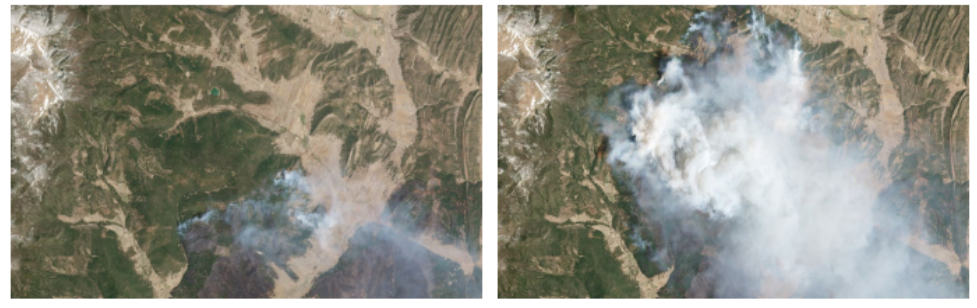
In the United States, during the mega-drought, New Mexico’s Calf Canyon fire was the largest fire in the History of the State: Imagery Source: Planet eBook
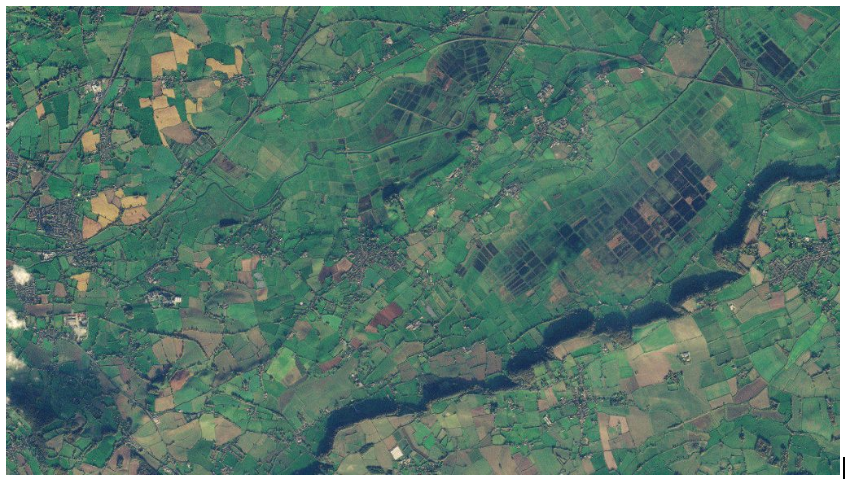
Satellite imagery in which each pixel translates to 3.7 m2 on the ground. This could be used to detect organic matter from sewage overspills and their downstream impact, which is used to monitor Sewages in the UK by the Planet Satellite Imageries: https://content.planet.com/c/monitoring-sewage
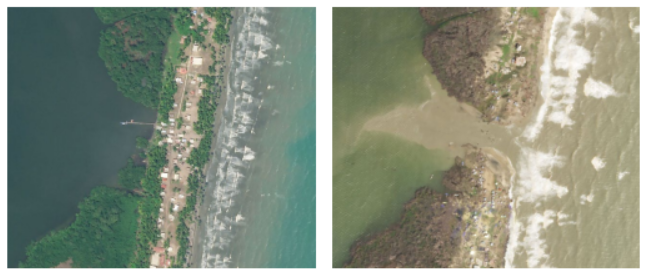
Damage assessment also can be made through Planet high-resolution Imagery to assess the Impact of Hurricane Iota in a small village community on the coast of Nicaragua: Picture Source : (Disaster & Management, 2022)
Planet has just acquired Sinergise, a Slovenian based Satellite Cloud-based repository platform; in this Gif, we are observing Drought monitoring areas near Nairobi, Kenya, in February 2023: Gif Source: Sentinel Hub
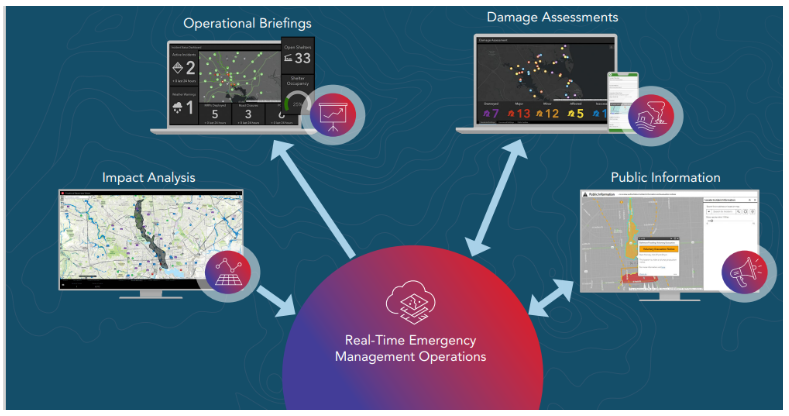
(Real Time Emergency Management Operation logistic scheme representation of ESRI, another pioneer organisation in Disaster Management using GIS technologies: Source: ESRI)
The ESRI Emergency Management team which a fully integrated GIS system that enables the disaster management teams for situational awareness at all points during the disaster response stage.
Humanitarian Mapping and OSM
When a powerful earthquake of 7.8 Richter scale struck the Levant region (Syria and Turkey), the Asia Pacific Open Mapping Hub used the Humanitarian Open Street Maps interface.
They were established in early 2021 and have extensively mapped in 25 different countries; they also provide financial and technical support to massively scale local edits on OpenStreetMap (OSM)
They are now actively working in Syria to map tasks in Aleppo and the surrounding regions.

( Image Source: The Asia-Pacific Open Mapping Hub affiliated with HOT have mapping using the HOT interface since 2021 and has mapped 25 countries so far that are prone to disaster: Picture Source: https://stories.hotosm.org/ap-homepage)
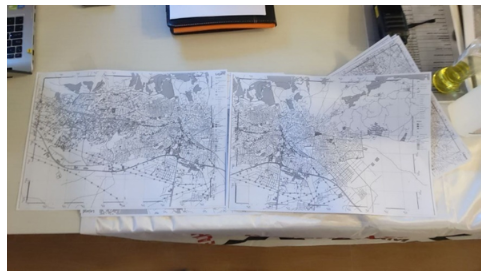
(In this Image, Open Street maps data that Yer Cizenler NGO is mapping is being used by AKUT Search and Rescue Association for helping and reaching out to the inhabitant. Source: https://www.facebook.com/YerCizenler).
References:
Disaster, P. F. O. R., & Management, E. (2022). Planet for Disaster & Emergency Management. 1–19.
EMMC. (2019). Man-Made Disaster | Monroe County, FL – Official Website. https://www.monroecounty-fl.gov/904/Man-Made-Disaster
IFRC. (2014). What is a disaster? – IFRC. http://www.ifrc.org/en/what-we-do/disaster-management/about-disasters/what-is-a-disaster/
Johnson, R. (2000). GIS Technology for Disasters and Emergency Management. Systems Research, May, 7. http://www.geo.umass.edu/courses/geo250/disastermgmt.pdf
Meaghan Kelly. (2020). 4 Phases Of Disaster Management Explained (The Easy Way). In AkitaBox.com (pp. 1–10).
Prasad, A. S., & Francescutti, L. H. (2016). Natural Disasters. In International Encyclopedia of Public Health (Second Edi, Vol. 5). Elsevier. https://doi.org/10.1016/B978-0-12-803678-5.00519-1
SAMHSA. (2022). Types of Disasters – Natural and Human-Caused Disasters | SAMHSA. In Substance Abuse and Mental Health Services Administration (SAMHSA). https://www.samhsa.gov/find-help/disaster-distress-helpline/disaster-types
Stallings, R. A. (1998). Man-made Disasters. In International Journal of Mass Emergencies & Disasters (Vol. 16, Issue 2, pp. 225–225). https://doi.org/10.1177/028072709801600210